What beach cleanup data tells us about plastic pollution is fairly simple to state: plastic dominates cleanup tallies by item count, single-use packaging and fragmented consumer products make up most of what washes ashore, and the same handful of items recur in the same places year after year. What those tallies cannot do is tell us how much plastic is in the ocean. Cleanup data is a repeated, standardised observation of one strip of shoreline at one moment, and reading it responsibly means knowing exactly what was measured.
That distinction matters more than it sounds. Headline figures from international cleanup programmes and local volunteer groups get quoted everywhere, from school assemblies to council meetings, and they are very good at showing which products fail and where. They are much weaker at measuring total marine plastic, and several structural blind spots sit inside every dataset.
This guide breaks down what each part of a cleanup record means, how the major datasets are built, why local results can diverge sharply from global averages, and what a community group should record if it wants its own numbers to be worth comparing with anyone else’s.
Table of Contents
- What Does Beach Cleanup Data Actually Measure?
- How to Read What Beach Cleanup Data Tells Us About Plastic Pollution
- Which Plastic Items Do Beach Cleanups Find Most Often?
- What Trends in Cleanup Data Are Meaningful?
- What Can Beach Cleanup Numbers Tell Us About the Sources of Plastic?
- Why Can’t Cleanup Counts Measure All Beach Plastic Pollution?
- What beach cleanup data tells us about plastic pollution: the practical ceiling
- How Can You Compare Cleanup Results From Different Beaches?
- What Should Cleanup Data Prompt Us to Do Next?
- Frequently Asked Questions
- What is the most common type of plastic found during beach cleanups?
- Are plastic item counts more useful than cleanup weights?
- Why do beach cleanup surveys not include all ocean plastic?
- Can beach cleanup data prove that marine plastic is increasing or decreasing?
- What is the most useful way to compare data from two beach cleanups?
- Conclusion
What Does Beach Cleanup Data Actually Measure?
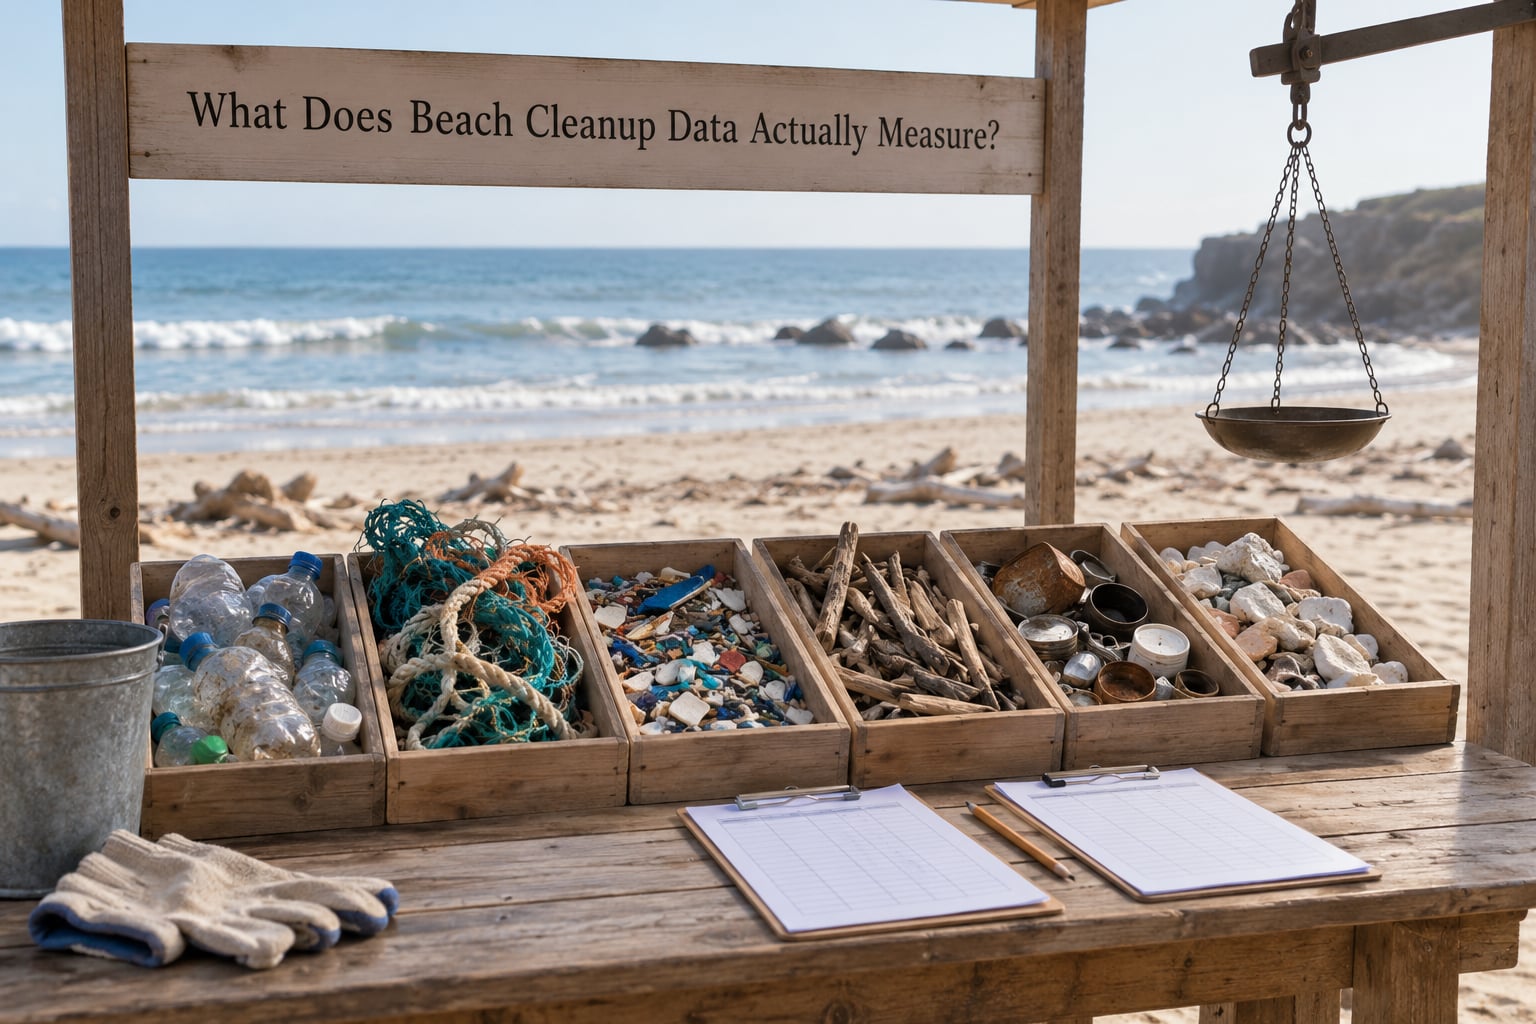
Beach cleanup data is a record of what volunteers physically picked up in a defined area during a defined time, sorted into a shared list of categories. Nothing more mysterious than that, and the definition matters because the same word, cleanup, covers everything from a 100-metre scientific survey to a 400-volunteer festival with music.
Five fields appear in almost every dataset, and you need all five before a number means anything:
- Item count — the number of individual pieces, not types. One torn wrapper counts once.
- Weight — total mass of what was bagged, usually on a hanging balance and recorded to the nearest gram or kilogram.
- Effort — number of volunteers and hours spent, which is what makes counts comparable between events.
- Area — either a fixed survey length, such as a 100-metre transect, or a total cleaned area in square metres.
- Category definitions — the item list used, which is what makes two datasets comparable at all.
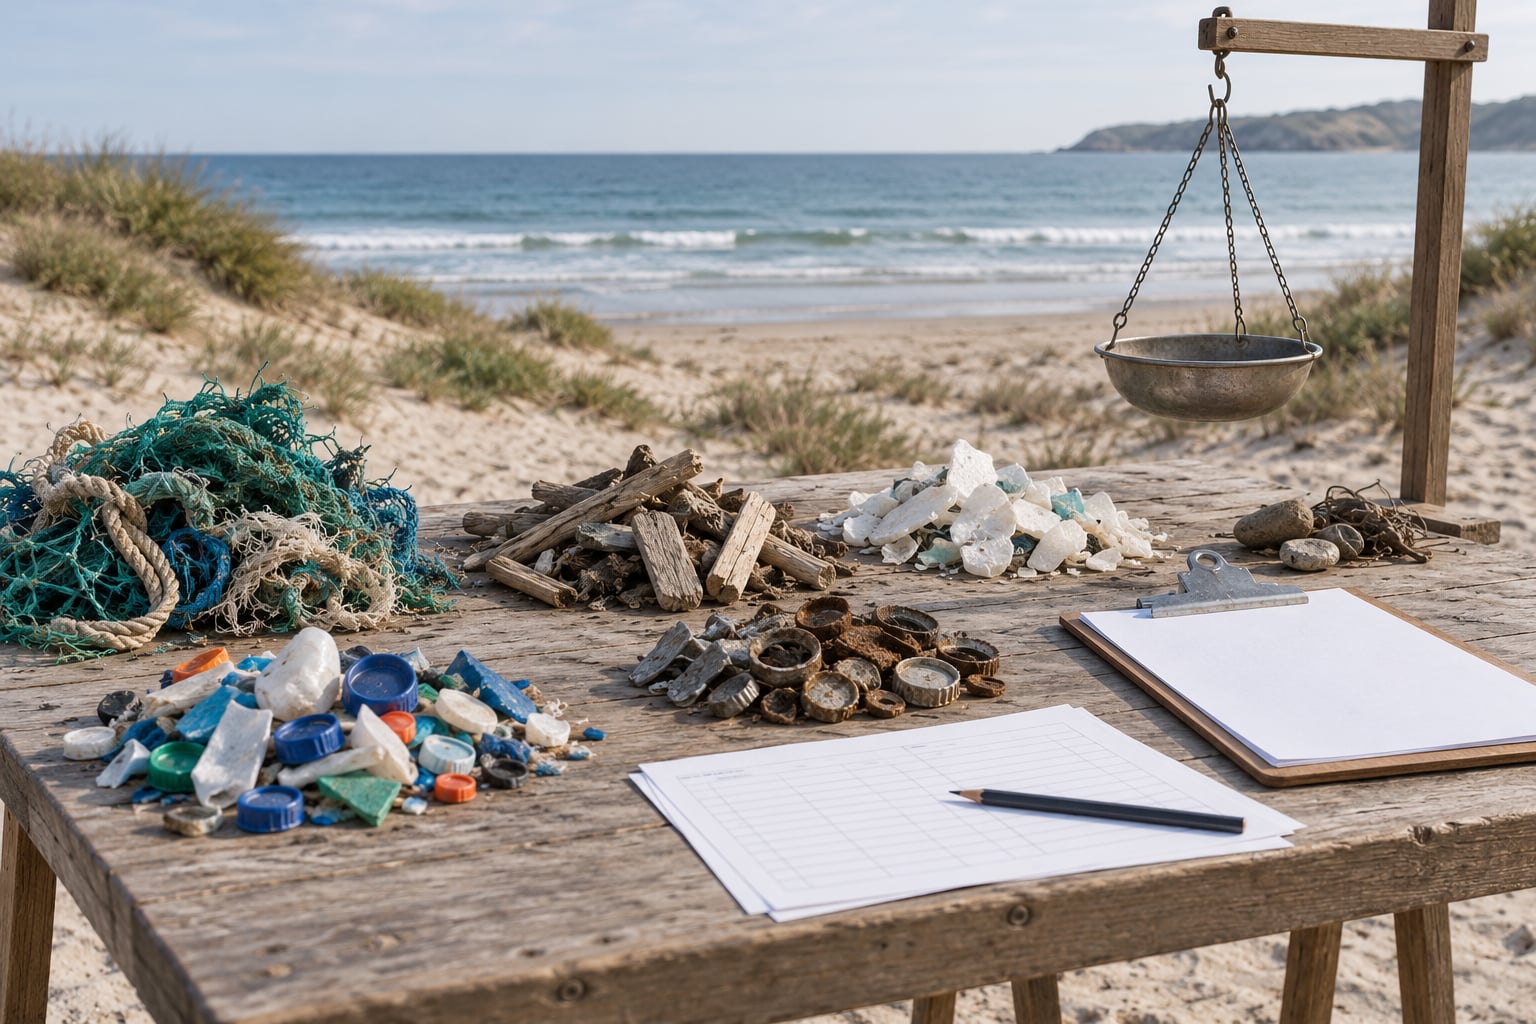
Three terms get thrown around without definition and are worth pinning down now. Macrodebris is anything larger than 2.5 cm, and it is what hand collection can realistically pick up. Microdebris sits below that threshold and includes microplastics; it needs nets, sieves or laboratory digestion, so it is almost absent from cleanup tallies. A waste transect is a fixed-length line walked along the shoreline, with everything inside a set width counted, which removes most of the guesswork from how much ground was covered.
On the data side, Ocean Conservancy’s Clean Swell app is the most widely used recording tool, and its records feed the TIDES global database. The International Coastal Cleanup shares the same harmonised macrodebris categories, so a group anywhere can log items in a way that researchers can pool. Surfrider Foundation chapters publish their own annual reports from their own volunteers using the same general approach.
Anyone who has tabulated a cleanup knows the first number on the sheet is the least reliable. Counts drift upward on hot days when people are tired and sorting lazily, and the small stuff gets missed entirely.
How to Read What Beach Cleanup Data Tells Us About Plastic Pollution
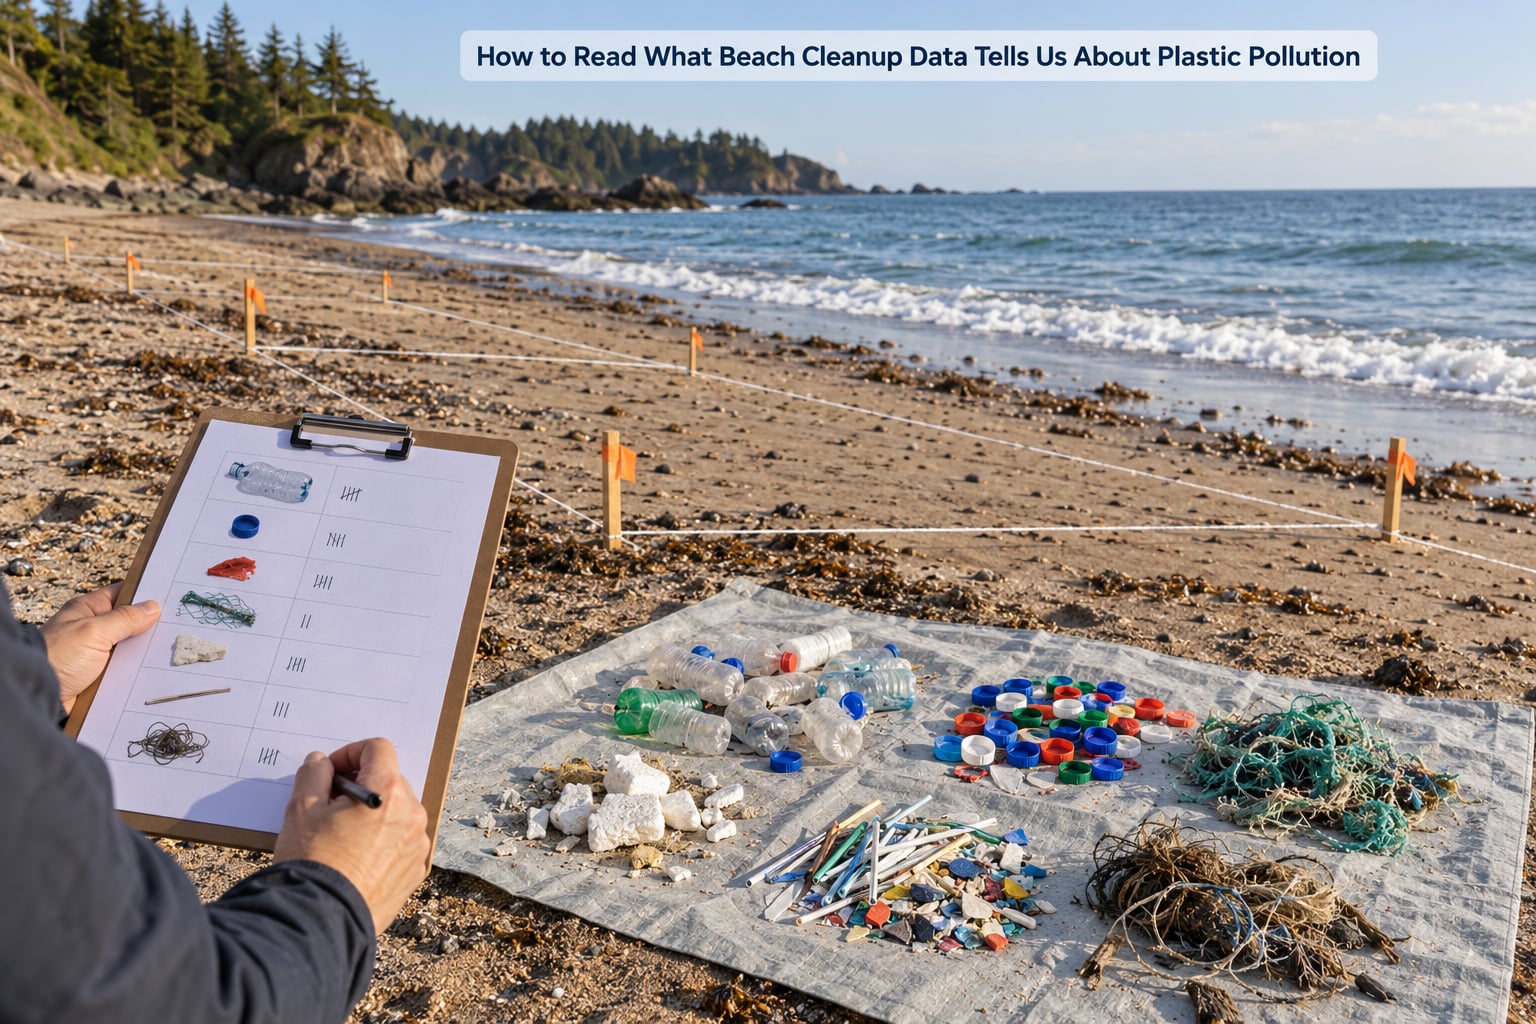
Read it as a map of arrival, not a measure of the total stock. Cleanup data shows which items reach shorelines, where they tend to pile up, in what season they appear and which size classes or uses dominate the haul. It tells you what the water and the wind delivered to that beach, and the shape of the deposit tells you a lot about the currents and the catchment behind it.
The most useful reading is comparative. The same beach surveyed repeatedly, using the same categories and a similar area, shows change. A local dataset compared against a national or international dataset shows whether the site is typical or an outlier, and outliers are usually the interesting ones.
One behaviour worth planning around is re-accumulation. Litter does not stay collected; it returns, sometimes within days in busy urban areas, which is why a single cleanup barely moves the needle and a repeated monitoring programme does. If you want your data to mean something, treat the cleanup as the sampling occasion and not as the solution.
The other thing the data tells you is about materials. In most programmes plastic accounts for the majority of items collected. Surfrider’s Ventura chapter reported 64% of items collected as plastic in its 2024 year-in-review, with cigarette butts ranked first for the fifth year running. That is a consistent, repeated signal about the products people use and drop.
Which Plastic Items Do Beach Cleanups Find Most Often?
The most-cited ranking comes from the Ocean Conservancy International Coastal Cleanup 2021 dataset, published in the Plastic Free July summary of the top ten items. It remains the clearest public snapshot of what cleanups actually pick up.
| Rank | Item | Items collected |
|---|---|---|
| 1 | Food wrappers | 1,341,463 |
| 2 | Cigarette butts | 1,134,292 |
| 3 | Plastic beverage bottles | 849,321 |
| 4 | Other trash | 613,972 |
| 5 | Plastic bottle caps | 579,020 |
| 6 | Plastic grocery bags | 415,245 |
| 7 | Glass beverage bottles | 304,337 |
| 8 | Beverage cans | 267,189 |
| 9 | Straws and stirrers | 260,395 |
| 10 | Plastic cups and plates | 245,961 |
Read the list carefully rather than as a league table of pollution. It is a ranking by piece count across a huge, geographically weighted programme, so it says more about what is small, light, common and easy to pick up than about tonnage. A single tangled net counts as one item and can outweigh every wrapper in the bag.
Local composition can look nothing like this list. A volunteer who joined a 24-hour cleanup described it on a forum as roughly 90% fishing related, a beach where gear and rope dominated completely. Sites near harbours, rivers and marinas tend to look different from open tourist beaches, which is exactly the kind of variation a national average hides.
Weight-based rankings look different again, and very few programmes publish them. That gap is a reason to be sceptical of any cleanup figure presented as a measure of pollution volume.
What Trends in Cleanup Data Are Meaningful?
A trend needs repeated observations, consistent method and enough time. One cleanup a year on the same stretch, with the same categories, can show direction; anything less shows weather.
Trends worth watching fall into a few groups. Changes in item mix tell you about product design and regulation, for example whether single-use packaging disappears from the tally after a local ban. Changes in size class tell you about fragmentation, where a shift toward fragments suggests larger items are breaking down in the water rather than arriving intact. Seasonal accumulation shows which products arrive with particular weather or tourism pressure.
Storm-related pulses are real and easily over-read. A single post-storm survey can show a dramatic spike that reflects one high tide, not a trend in input. Before declaring any change, normalise the figures: items per volunteer-hour, or items per 100 metres of surveyed shoreline, or weight per square metre. Raw totals mostly measure how many people showed up.
Then test whether an intervention actually worked. If a container deposit scheme started in your area, the question is not whether litter vanished but whether beverage containers fell relative to other categories, in comparable surveys, across more than one season.
What Can Beach Cleanup Numbers Tell Us About the Sources of Plastic?
Category mix narrows the source, though it rarely proves it. Food wrappers, cigarette butts, straws and stirrers and bottle caps cluster around human activity at the shoreline itself: littering, bins overflowing near a beach entrance, restaurant waste and stormwater outfalls that discharge after rain.
Light, buoyant packaging fragments often arrive from further inland or upstream through stormwater drains and wastewater outflows, having travelled a river or a drain before reaching the sea. That is why an urban catchment beach and a rural one can have completely different profiles from neighbouring stretches of the same coast.
Fishing and boating gear tells a different story: nets, rope, floats, crates and buoys cluster near ports, moorings and working coastlines. This is the category most likely to diverge sharply from consumer-packaging-dominated national averages, and it deserves its own monitoring effort rather than being averaged away.
And a large share of what is counted is no product at all any more, just fragments too degraded to identify, which points to the long tail of large items breaking down rather than to a fresh input. Appearance rarely identifies a brand or a producer, so treat any cleanup dataset as evidence about product types and pathways, not about who is to blame.
Why Can’t Cleanup Counts Measure All Beach Plastic Pollution?
Five limits sit inside every cleanup dataset, and knowing them is the difference between using the numbers and being used by them.
The first is sampling bias. Volunteers work where parking, access and organisation make cleanup easy, which usually means accessible, popular, urban-adjacent beaches. Remote coves and dunes with heavy accumulation are systematically under-sampled, so a network-wide figure tends to describe the places that are easiest to reach.
The second is the microplastic blind spot. Anything below 2.5 cm is effectively invisible to hand collection, and that includes microplastics, fragments and pre-production plastic pellets, often called nurdles. A cleanup that records only macrodebris is not measuring the smaller share of pollution at all, which is why complementary methods exist.
The third is what leaves between cleanups. Tides carry debris out to sea and back in at a different angle, storms move large volumes inland or offshore, and sand burial hides items that reappear after a month. A survey records what was on the surface at that hour.
The fourth is the count-versus-weight problem. Item counts reward small, light objects, so a beach can top the ranking on cigarette butts and still contribute very little mass. Weight rewards the opposite. Any claim about how much plastic exists needs one unit stated explicitly.
The fifth is definitional drift. When two datasets use different category lists, or when one counts a broken bottle as two fragments and another counts it as one item, comparisons break down quietly.
What beach cleanup data tells us about plastic pollution: the practical ceiling
Put plainly, cleanup data is strong evidence about arrival, material and location, and weak evidence about totals. It describes shoreline abundance under specific conditions. It says nothing directly about the water column, about the seabed, or about plastics moving between compartments, and anyone presenting a cleanup tally as a measure of ocean plastic has stretched it past what it can carry.
How Can You Compare Cleanup Results From Different Beaches?
Two datasets are comparable when the method matched before the numbers do. Check these eight things in order, and drop the comparison if any of them fails:
- Survey area or transect length, and whether the width covered was the same.
- Tide stage and time of day, since the tideline moves the working area.
- Season and weather in the days before the survey, including any storm.
- Time spent and volunteer numbers, to convert to effort-based units.
- Item classification list and size threshold used.
- Reporting unit, item count, weight or volume, and never a mix of the two.
- Whether microdebris was counted at all, and how.
- Whether both datasets recorded every item, or only items above a visibility limit.
Once those match, normalise. Items per volunteer-hour, items per 100 metres of shoreline or weight per square metre are the three units I would trust for comparison. Raw totals across two different beaches usually tell you which event had more people.
Where a method differs, say so rather than averaging it away, and keep the two results in separate columns. An honest mismatch is more useful than a blended average.
What Should Cleanup Data Prompt Us to Do Next?
Turn the numbers into prevention priorities rather than tidy satisfaction. If wrappers, caps and bottles dominate the count, the ask is packaging reduction and deposit-return schemes, which over 40 countries now operate, with research suggesting container deposits cut beverage container litter substantially. If gear dominates locally, the conversation is with harbour authorities, fishing operators and lost-gear recovery.
Keep monitoring the same way you cleaned. Repeat the transect, keep the categories, keep the units, and record effort every time; only a consistent series can show whether an intervention worked. That series is also the most persuasive thing you can put in front of a council.
Improve the system around the beach, because litter arriving on the sand usually passed through a bin, a drain or a boat first. Waste collection that keeps pace in summer, storm drain maintenance, bin placement at beach entrances and reception facilities for fishing gear all change what the next survey finds.
And stay honest that cleanup is not a substitute for turning off the tap. Global estimates put plastic entering aquatic environments at over 50 million metric tons a year, with rivers alone carrying an estimated 100,000 to 300,000 tonnes annually. No number of volunteer hours closes that gap, and the most valuable thing a cleanup produces is the record of what keeps arriving.
Frequently Asked Questions
What is the most common type of plastic found during beach cleanups?
Food wrappers, cigarette butts and plastic beverage bottles sit at the top of international coastal cleanup tallies by item count, followed by bottle caps, plastic bags, straws and stirrers, and plastic cups and plates. That ranking counts pieces, not weight, so it favours small light items, and local beaches with fishing gear can look completely different.
Are plastic item counts more useful than cleanup weights?
Both matter and they answer different questions. Item counts show which products fail and how many pieces reach a shoreline; weights show how much mass was actually removed. A bag of cigarette butts can top a count ranking and contribute almost no mass, while one tangled net counts as a single item. Report the unit explicitly whenever you quote a figure.
Why do beach cleanup surveys not include all ocean plastic?
Cleanup surveys record macrodebris, meaning items larger than 2.5 cm, because that is what volunteers can pick up. Anything smaller, including most microplastics and plastic pellets, needs nets, sieves or laboratory digestion. Debris also moves between sand, surf and open water between visits, and surveys only cover the accessible stretch of shoreline on the day.
Can beach cleanup data prove that marine plastic is increasing or decreasing?
Not on its own. A single survey reflects one tide, one weather week and one volunteer turnout, and easy-access beaches are over-sampled while remote ones are missed. Direction becomes credible only when the same stretch is surveyed repeatedly with the same categories and the same unit, ideally for several seasons, and figures are normalised per volunteer-hour or per 100 metres.
What is the most useful way to compare data from two beach cleanups?
Match the method before comparing the numbers. Check survey area or transect length, tide stage, season and recent storms, volunteer hours, the item classification list, the size threshold and the reporting unit. Then normalise to items per volunteer-hour or per 100 metres of shoreline. If any of those differ, keep the results separate instead of averaging them.
Conclusion
Beach cleanup data is genuinely good evidence about what reaches shorelines: which products leak, where they accumulate, in what season and in what quantity of pieces. It is not a census of marine plastic, and it cannot be read as one. Before drawing any conclusion from a figure, check five things first: the survey method, the area covered, the unit reported, the date, and the category definitions. Get those right and the numbers become useful for the only job they were ever built for, which is telling us what to stop sending ashore.