A water quality report for your tap water is the annual document your water supplier is required to publish, and reading it takes about 20 minutes once you know which column matters. The official name is the Consumer Confidence Report (CCR): it lists every contaminant tested, how much was found, and whether that amount stayed under the legal limit.
Most of the confusion comes from the acronyms. The report is written for regulators, not for the person drinking the water. Once you can tell an MCL from an MCLG and a detection from a violation, the rest is straightforward.
If you are on a public system, you already have one. If you rely on a private well, no report will arrive and you have to test the water yourself.
Table of Contents
- What You Need
- Step-by-Step
- Identify the report type and reporting period
- Start with the executive summary or certification statement
- Understand what was tested and where
- Read each measurement beside its comparison value
- Check the important contaminants and treatment indicators
- Separate detected levels from exceedances
- Investigate footnotes, tables, and corrective actions
- Decide what to do next
- Common Mistakes
- Frequently Asked Questions
- How do I read a water quality report for my tap water?
- What is the maximum contaminant level goal (MCLG)?
- What are considered high lead levels in water?
- What do ppm, ppb and mg/L mean in a water report?
- Is my tap water safe to drink if every result is under the MCL?
- Do I have to be a utility customer to get a water quality report?
- Conclusion
What You Need
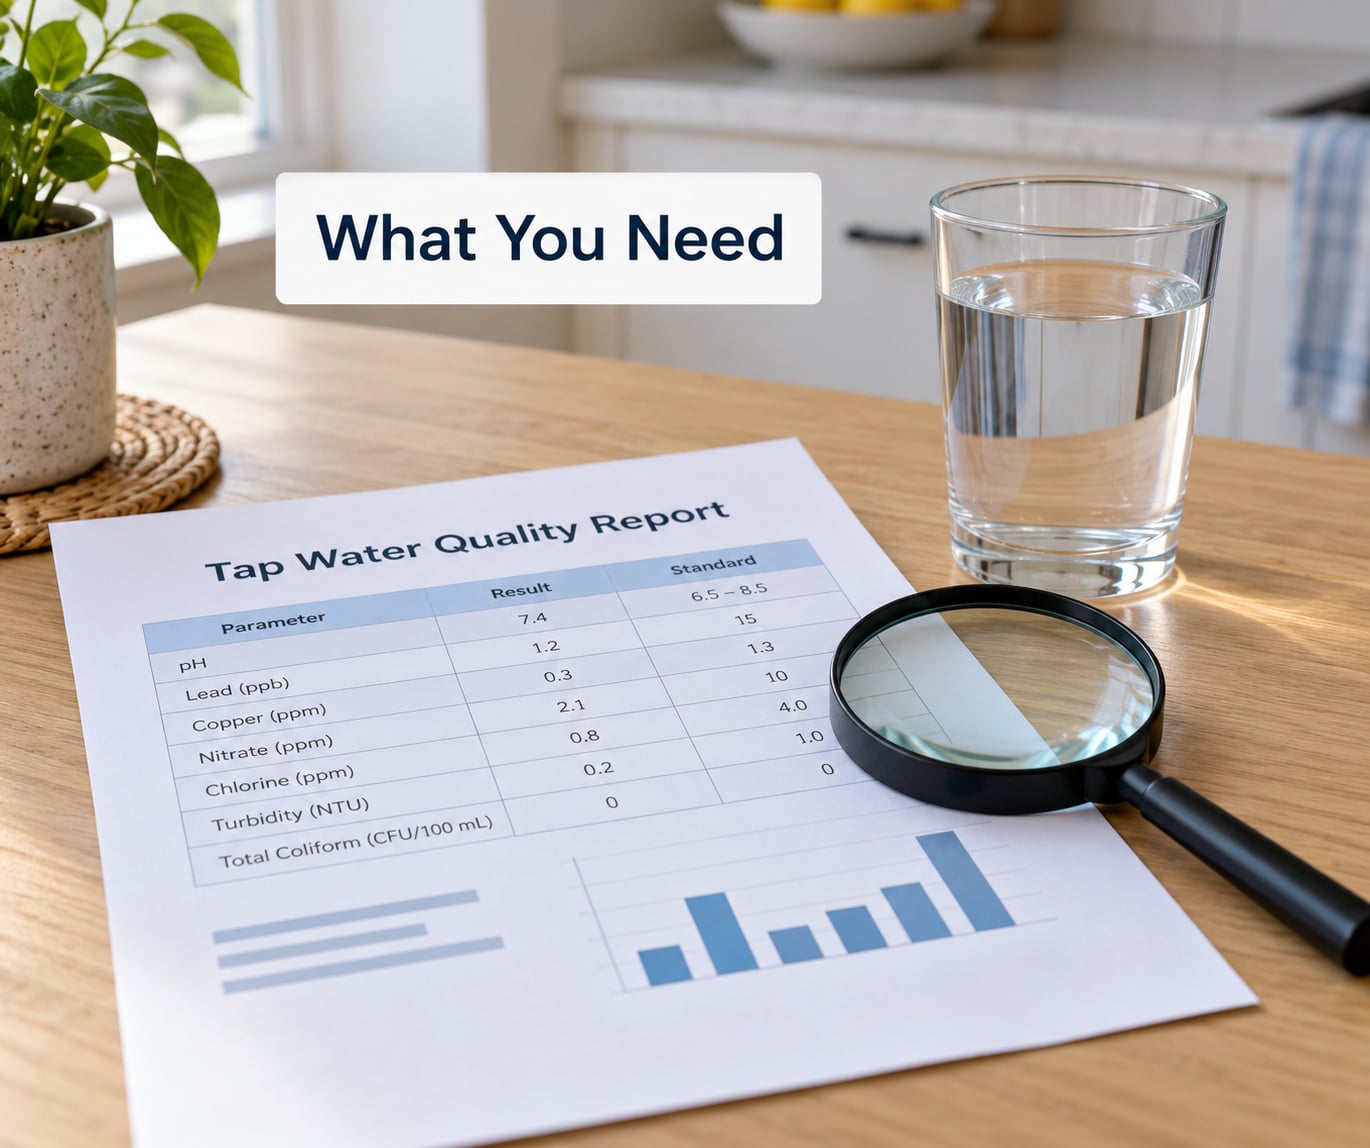
You need four things, and none of them cost anything. Most people can gather them in five minutes.
- The report itself. Public water systems have to deliver it to customers every year, usually by July 1, and many mail it folded into the summer water bill. If you never saw one, check the utility website, the billing portal, or the envelope inserts on your counter from the last few months.
- Your utility’s contact details. The phone number and the name of the water quality or compliance officer appear in the first page or the contact section. Save it before you get to the tables, because that is the person who can explain a footnote you do not understand.
- The local drinking-water standards. In the United States these are the EPA’s National Primary Drinking Water Regulations, adopted under the Safe Drinking Water Act of 1974 and amended substantially in 1986 and 1996. Most CCRs print the limit next to each result, so you rarely need to look anything up separately.
- A short decoder for the acronyms. Six terms cover almost everything: MCLG, MCL, TT, MRDL, MRDLG and action level. Here is what each one means and where you will see it.
| Term | What it is | Enforceable | Where it shows up |
|---|---|---|---|
| MCLG | Maximum Contaminant Level Goal: the level at which a person could drink the water daily for a lifetime with no health effect, adjusted for taste and appearance | No, it is a health target only | Next to the MCL in the contaminant table |
| MCL | Maximum Contaminant Level: the highest concentration legally allowed in treated water | Yes, this is the legal limit | The “MCL” column of every contaminant table |
| TT | Treatment Technique: a required process rather than a number, used for contaminants like turbidity and coliform bacteria | Yes | Footnote and “Treatment Technique” notes |
| MRDL | Maximum Residual Disinfectant Level: the legal ceiling for leftover chlorine or chloramine | Yes | Disinfection section |
| MRDLG | Maximum Residual Disinfectant Level Goal: the health-based level of residual disinfectant | No | Disinfection section, beside the MRDL |
| Action level | A trigger used by the Lead and Copper Rule that starts a required process; it is not an MCL and does not work the same way | Yes, through a process requirement | Lead and copper section |
If that table alone tells you what you needed, you can stop here. If not, the next section walks through the report in order.
Step-by-Step
Work through the document in this sequence and you will never misread a number, because each step gives you the context for the next one.
Identify the report type and reporting period
Four different documents go by a similar name, and only one of them is the annual CCR.
An annual drinking-water quality report covers a calendar year of monitoring and is the full document. A monitoring notice or public notice is a short form published when a system misses a monitoring requirement, fails a treatment standard, or has an emergency such as a boil-water advisory. A consumer notice often goes out with the bill to explain a specific result or a planned change. A private well lab report is a private document from a testing laboratory that covers only the sample you paid for.
Read the year printed on the cover before anything else. A report for last calendar year is the most recent annual document your utility owes you, and the measurement year is often different from the year you receive it.
Start with the executive summary or certification statement
Open to the section that says something like “Executive Summary”, “Quality Assurance” or “System Information” and read the opening sentences. That paragraph usually tells you the source of the water, how much you were supplied, whether the system met all applicable drinking-water requirements, and whether any violations occurred during the year.
This is the fastest way to get the answer. If the statement confirms full compliance and no violations, the rest of the report is context, not bad news. If it names a violation, an enforcement action or a public notification, you have your first concrete reason to contact the utility.
Understand what was tested and where
Most results come from two places. Water leaving the treatment plant tells you what the utility did to it. Water sampled in the distribution system, usually at customers’ taps, tells you what reaches your glass. Both matter, and they answer different questions.
Look for the sampling location in the footnote under the table, and for the source water description, which is often an aquifer, a reservoir, a river or a well field. A shallow river intake during heavy rain can produce a turbidity spike that a groundwater system will never record, which is why reports are specific to the system and the watershed they describe.
Also check which year the data covers. Tables are often split into “detected contaminants” and “regulated contaminants with no detections”, and the year heading can differ between them.
Read each measurement beside its comparison value
This is where almost everyone stops reading. A contaminant row usually contains a name, a typical source, your result, the MCL, the MCLG and a violation column. Read across the row in that order, one line at a time.
Start with the violation column first, before the numbers. If it reads “No”, the row is informational and you can move on in seconds. If it reads “Yes”, the row deserves your full attention, including the footnote about what the system did about it.
Then compare the result with the MCL. A result below the MCL means the number is under the legal limit. A result above the MCL means a violation occurred for that monitoring period, unless a footnote explains an averaging or variance allowance.
Compare the result with the MCLG too, and note the gap. The MCLG is the health target; the MCL is often looser because treatment technology cannot reliably do better. Where the two are far apart, that is a design decision rather than an error, and it is worth knowing if you are pregnant, have a child under six, or are immunocompromised.
Check the important contaminants and treatment indicators
Not every line carries the same weight. Health-risk contaminants have legal limits because of known health effects. General indicators tell you whether the treatment process worked. Nuisance parameters affect taste, smell, staining and appliance life but not health.
Lead has no MCL. The Lead and Copper Rule sets an action level of 0.015 mg/L, which is 15 parts per billion, and it is evaluated at the 90th percentile of tap samples rather than at an average. If the report shows lead at 20 ppb, that figure sits above the action level and means the system has further obligations. See the units note below, because lead numbers get reported in wildly different ways.
Coliform bacteria are indicators that the water was not properly disinfected or that the distribution system let contamination in. The rule for total coliform in the distribution system is a treatment technique rather than a number, and any positive detection requires follow-up sampling. Nitrate has an MCL of 10 mg/L measured as nitrogen, driven mostly by fertilizer runoff and septic systems. Arsenic has an MCL of 0.010 mg/L, common in groundwater in parts of the West.
Disinfection by-products such as trihalomethanes (MCL 80 ppb) and haloacetic acids, the group often labelled HAA5 (MCL 60 ppb), form when chlorine reacts with organic material. They appear near the top of many reports because plants are required to monitor them, and their presence is expected rather than a fault. Turbidity is cloudiness; the treatment rule allows up to 0.3 NTU in 95 percent of samples and never above 1.0 NTU. Residual chlorine is shown as an MRDL of 4.0 mg/L for free chlorine, and the residual is what keeps water safe between the plant and your tap. pH matters mostly as a corrosion signal, since water that is too acidic or too alkaline can pull lead and copper out of service lines and household plumbing.
Hardness, iron, manganese, chloride and sulfate usually sit in the unregulated or nuisance section. High hardness is often listed with a number in grains per gallon, and a value of 7 to 12 gpg simply means hard water and white laundry. It is not a health finding.
Nitrate, lead and arsenic are the three rows worth reading every year, even in a clean report. Everything else changes slowly, and those three move with land use, pipe work and household renovation.
Separate detected levels from exceedances
A detection means the laboratory found the substance at a level above the method’s detection limit. It is not the same as a violation. Many CCRs deliberately publish detections below the MCL, which is why the report can list a number that still triggers no action.
An exceedance means the result was at or above the limit that applies to it, whether that limit is an MCL, an MRDL, a treatment technique requirement or a lead action level at the 90th percentile. That triggers a defined follow-up, and in most cases a public notice.
| Contaminant | Your result | Comparison value | Column | What it means |
|---|---|---|---|---|
| Nitrate | 2.1 mg/L | MCL 10 mg/L | Violation: No | Detected, well under the legal limit, nothing to follow up |
| Lead | 18 ppb at the 90th percentile | Action level 15 ppb | 90th percentile above action level | Not an MCL exceedance, but the system must act under the Lead and Copper Rule |
One more distinction worth keeping straight: a “treatment technique violation” means a required process or monitoring step went wrong, not necessarily that the water was unsafe to drink. The distinction matters when you decide whether to use an alternative water source.
Investigate footnotes, tables, and corrective actions
The footnotes under the tables carry the parts people skip, and they often change the meaning of the number above them. Look for notes about averaging across monitoring periods, a reduced monitoring frequency, alternate compliance routes, treatment technique changes, and any public notification issued during the year.
A few phrases are worth decoding. “Reporting requirements” and “complaint” indicate monitoring or paperwork issues rather than water quality. “Monitoring and reporting violation” is paperwork. “An exceedance” followed by a date tells you when it happened and lets you match it against any press release or letter the utility sent.
Also check whether the report includes tables for unregulated contaminants, and whether the state or the utility publishes a separate notice when treatment, sampling locations or ownership change. The Consumer Confidence Rule requires utilities to disclose significant changes in operations, ownership or source water.
Decide what to do next
Four situations cover nearly everything.
The report shows full compliance. Nothing urgent. If taste, odour or staining bothers you, that is a nuisance parameter question, and a specific filter or a utility call will fix it. Save the report for the year your service line or fixtures are replaced.
One nuisance parameter is high. Hardness, iron and manganese explain most complaints. Call the utility and ask whether they treat or soften, and what hardness level reaches your service area.
A contaminant exceeded an MCL or a lead action level. Contact the utility and ask for the corrective action plan, the date of the exceedance, the sampling location and the tap-specific results if lead is involved. Run cold tap water for two to three minutes before drinking or cooking, and keep hot tap water out of drinking and food preparation, since heating releases more lead from solder and fixtures. Then check the section called “Public Notification” in the report, which tells you how and when the system warned customers.
The report is missing, the utility will not answer, or results feel implausible. Escalate. Go to the state primacy agency that regulates your utility, then the EPA Safe Drinking Water Hotline, which takes complaints from anyone, not just utility customers. Renters can start with the landlord or building manager, who is the account holder. If you suspect an acute problem, the local health department is the right first call.
If you have any symptoms you think are connected to water, ask a doctor rather than diagnosing it from a table of numbers. A report tells you what was measured, not how your body is responding.
Common Mistakes
Comparing unlike units. This is the single most frequent error. mg/L and ppm mean the same thing for water, while ppb is a thousandth of ppm. A number printed as “20 ppb” and one printed as “20 ppm” differ by a factor of a thousand, and “20 ppm lead” is not a plausible tap-water result in units of ppb. Convert before you worry.
Ignoring the date and the sampling location. A result from the plant outlet in January says little about the tap in your kitchen in August. What you want is the most recent sample from the distribution system near your address.
Treating a detection as a violation. The word “detected” appears on compliant reports all the time. Only the violation column, or a value at or above the limit, changes the situation.
Skipping the footnotes. Averaging periods, alternative compliance and reduced monitoring frequency can each explain why a number looks confusing. The footnote often carries the real story.
Reading the MCL as a target for healthy water. An MCL is a legal ceiling, not a comfort level. Advocacy groups such as the Environmental Working Group publish their own health-based guidelines, often far lower than the legal limits for the same contaminants. Those are useful perspective for sensitive households, and they carry no legal force.
Assuming an annual report describes every tap. It describes a system, sampled at a limited number of points on a schedule. Lead varies house to house by plumbing age, and a system-wide average can hide a single building. After a pipe replacement, a tap-specific test is the only meaningful number.
Assuming the report covers a private well. It never does. No utility monitors your well, and annual testing for total coliform and nitrates, plus periodic testing for other local risks, is the owner’s responsibility.
Expecting zero detections. Chlorine residual, hardness and some disinfection by-products appear in nearly every report. A clean report is one where the numbers are under the limits and the violation column is empty, not an empty table.
Frequently Asked Questions
How do I read a water quality report for my tap water?
Start with the opening statement that confirms compliance, then read each contaminant row left to right: name, typical source, your result, the MCL, the MCLG and the violation column. Check the violation column first, because if it says No the row needs no further attention. Finish with the footnotes, which explain averaging periods and required corrective actions.
What is the maximum contaminant level goal (MCLG)?
The MCLG is the contaminant level at which a person could drink the water daily for a lifetime with no expected health effect, adjusted for taste and appearance. It is a health target rather than a legal standard. Utilities are required to treat water to meet the MCL, which is often higher than the MCLG because of what treatment technology can reliably achieve.
What are considered high lead levels in water?
Lead has no MCL. The Lead and Copper Rule uses an action level of 0.015 mg/L, equal to 15 parts per billion, measured at the 90th percentile of tap samples. A result above that triggers required steps such as treatment changes, tap sampling and public notice. Note the units carefully, since a lead figure quoted in ppm instead of ppb changes the meaning by a factor of a thousand.
What do ppm, ppb and mg/L mean in a water report?
For water, mg/L and ppm describe the same concentration. One ppb is a thousandth of a ppm, so 15 ppb equals 0.015 mg/L. Grains per gallon measures hardness rather than contamination. When you compare a report value with a limit, first confirm both numbers use the same unit, since comparing 20 ppb against a 0.015 mg/L limit is a very different judgement from the reverse.
Is my tap water safe to drink if every result is under the MCL?
If the report shows compliance and no violations, your water met the legal drinking-water standards for the monitoring performed. That is meaningful assurance, but the limits are ceilings rather than targets, and a system-wide average can hide older homes with different plumbing. Pregnant people, children under six and immunocompromised households may choose a filter that targets a specific contaminant below its legal limit.
Do I have to be a utility customer to get a water quality report?
Public water systems must deliver the annual report to customers, and it is usually posted online for anyone to read. Renters and apartment residents have the same right even though the landlord holds the account, so ask the building manager for the report or find the utility by your service address. Private well owners are not covered by any utility report and must arrange their own testing.
Conclusion
Three actions, in order. Find the report for the most recent year and check that it covers your service area. Read the opening compliance statement and the violation column before reading any single number. Then look closely at lead, nitrate and arsenic, confirm the units match the limits printed next to them, and read the footnotes.
If everything passes, you have the free official audit of your tap water in your hands and nothing further to do. If a result exceeds its limit, call the utility for the corrective action plan, then your state primacy agency if the response is slow or vague.