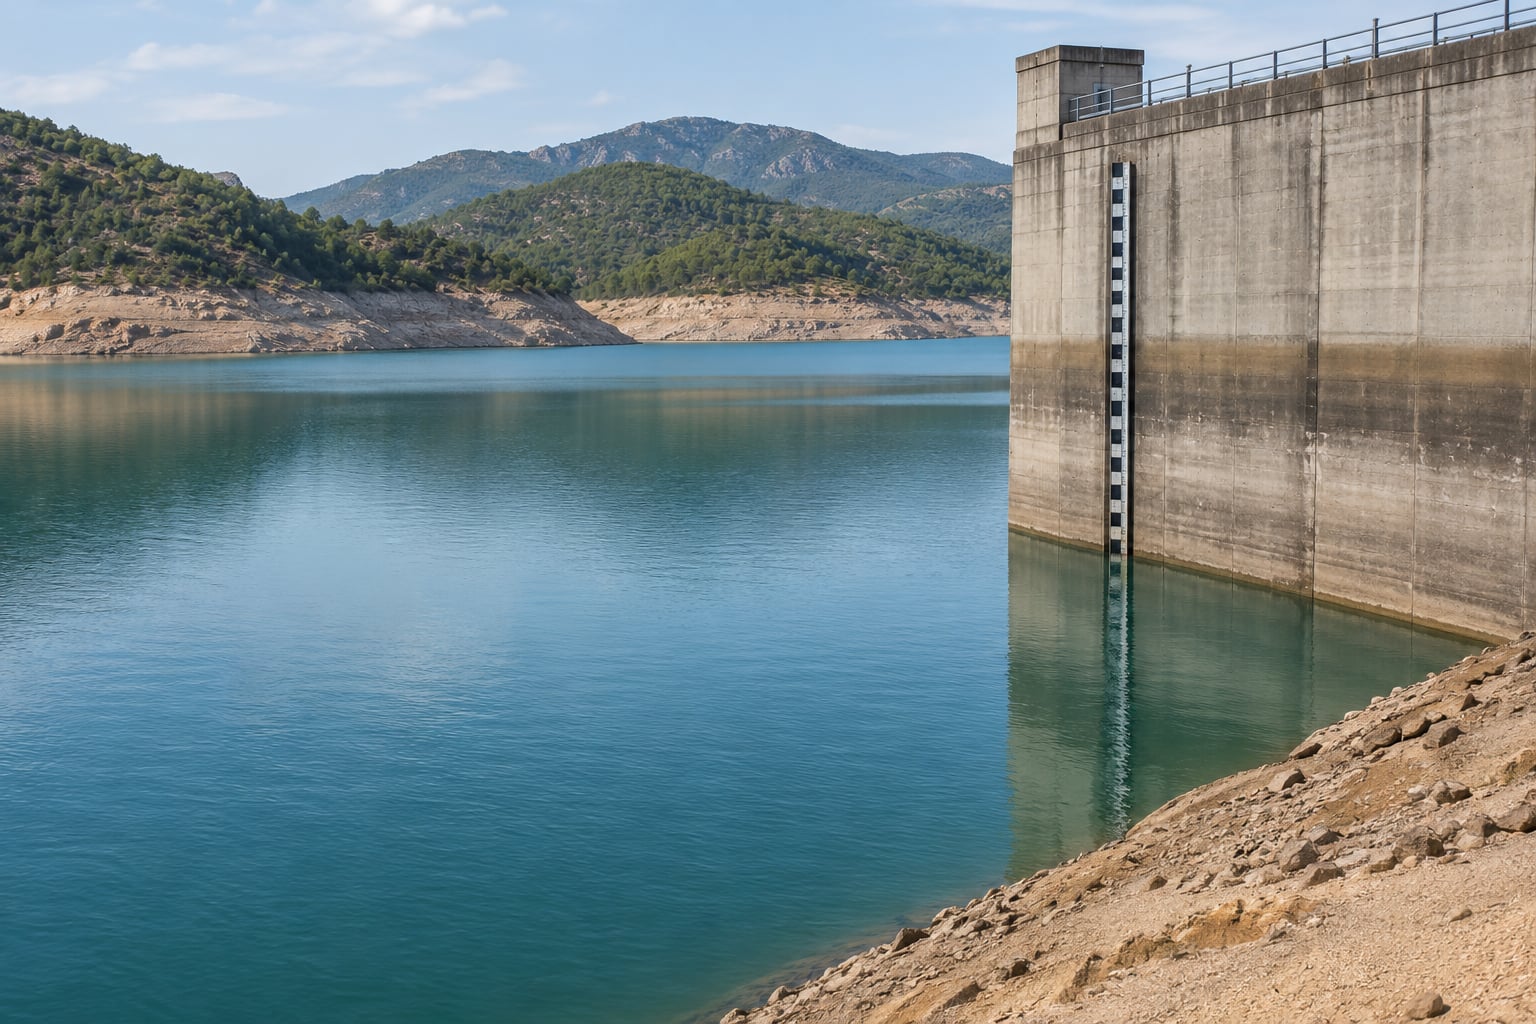
What reservoir levels tell you about water supply is really a question about reliability rather than volume. A reading shows how much water is stored, how fast that stock is changing, and how far it sits above or below the usual level for that date. It is a strong signal of risk, and a weak guarantee of what arrives at any single tap.
The most common misunderstanding is the jump from a percentage straight to a personal verdict. Ninety percent full sounds safe. Ninety percent full in the last week of August, in a basin whose average in late August is around seventy, is not the same thing at all.
Table of Contents
- What Reservoir Levels Tell You About Water Supply
- How to interpret what reservoir levels tell you about water supply
- How reservoir storage levels and percentages are measured
- Why one reservoir level does not determine household water
- How seasonal trends change the meaning of a percentage
- Why falling levels matter even before restrictions begin
- How drought, climate change and competing demand affect reservoirs
- Where to find reliable reservoir-level information
- How to judge whether water supply is at immediate risk
- Frequently Asked Questions
- Is a low reservoir percentage an immediate sign that taps will run dry?
- What percentage of reservoir capacity is considered low for water supply?
- Why can one region have drought restrictions while reservoirs elsewhere remain full?
- Can reservoir levels recover quickly after rainfall?
- How do reservoir levels affect household water pressure and restrictions?
- Should residents rely on reservoir data or local groundwater and river levels?
- Conclusion
What Reservoir Levels Tell You About Water Supply
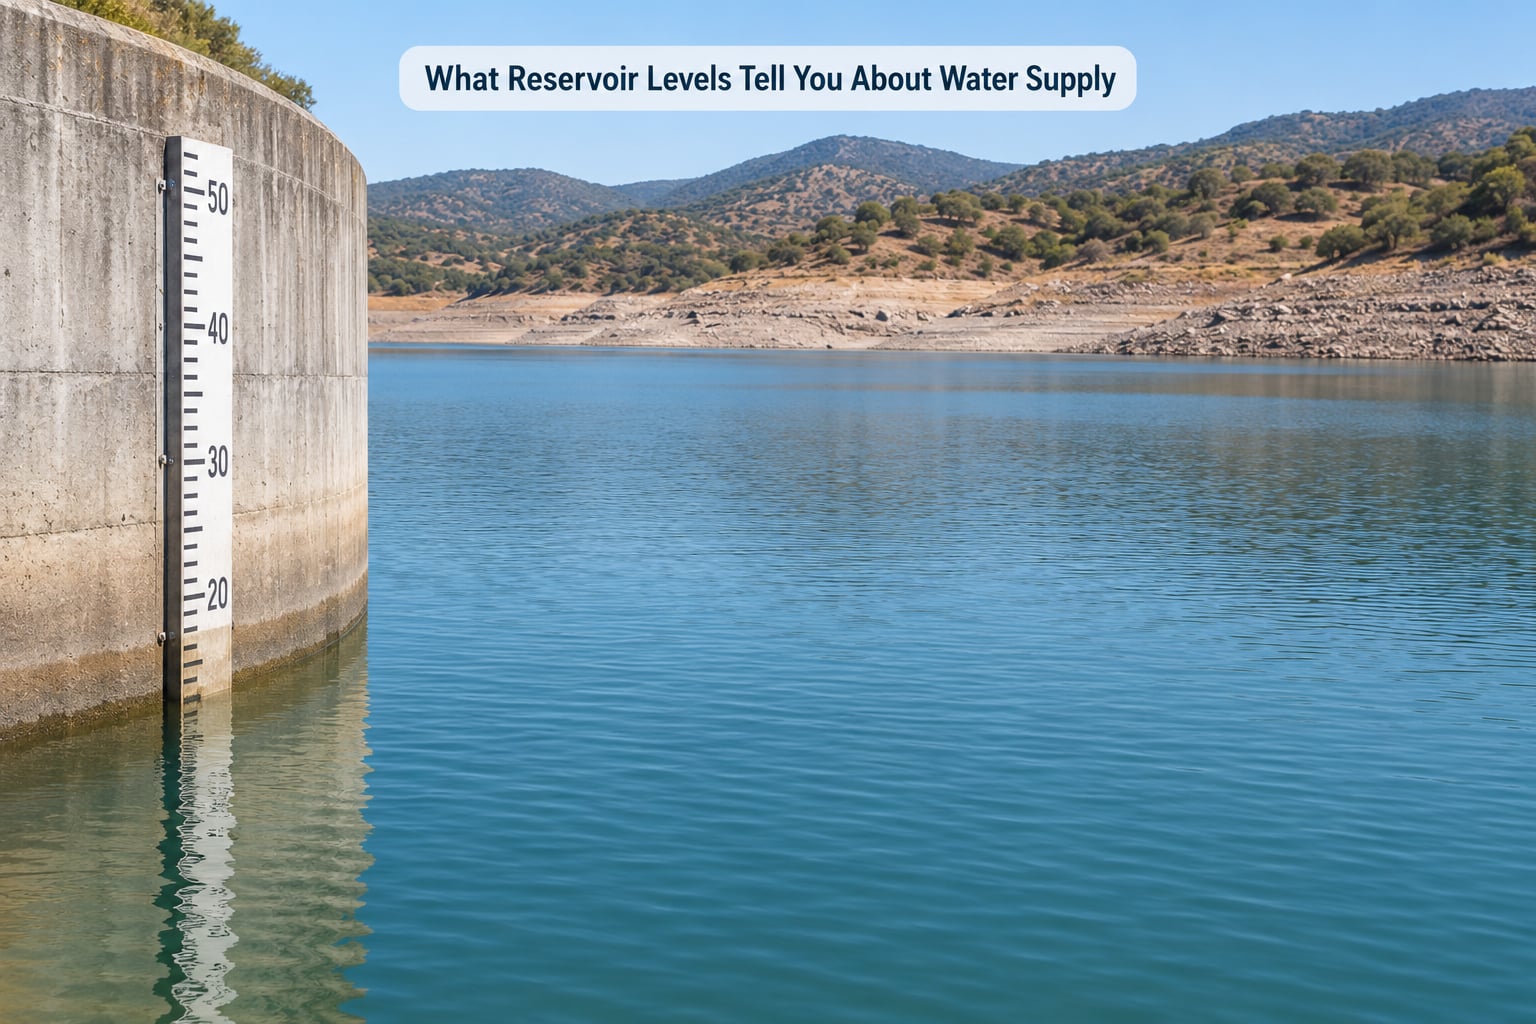
A reservoir level tells you four things: how much water is stored, which direction that stock is moving, how the amount compares with demand at that moment, and how much room is left for a dry spell. It does not tell you whether your local utility can treat and deliver it.
How to interpret what reservoir levels tell you about water supply
Start with volume. A higher percentage of capacity usually means more resilience, because more stored water can absorb a failed inflow, a hot week of heavy demand or a delayed refill. A lower percentage means less margin, so the same failed inflow produces a bigger drop.
Then look at direction. A reservoir at seventy percent and rising after a wet week is in a different position from one at seventy percent and falling through a dry fortnight. Trend over two to six weeks carries far more information than a single number.
Third, compare against the right benchmark. The historical average for that reservoir on that date matters more than the raw percentage of total capacity. Most reservoirs refill in winter and drain in summer, so a summer drawdown is normal and a winter figure is the one that tells you whether the system started the hot season healthy.
Finally, ask what the number is being used for. The same stored water may be earmarked for drinking water, irrigation, hydropower generation, flood protection or ecological flow, and one reservoir usually serves several of those at once.
How reservoir storage levels and percentages are measured
Every published percentage rests on two figures: the total volume the reservoir was designed to hold, and the volume of water in it right now. The percentage is simply the second number divided by the first, multiplied by one hundred.
That sounds obvious, but the denominator is not what it looks like on a map. Total capacity normally sits above the dead storage level, which is the volume below which water cannot be released through the outlet works for supply. Dead storage is often there for structural stability or for sediment and safety reasons. It is water in the basin that cannot be delivered to a customer.
Sedimentation shrinks the denominator over decades. A dam built with a given capacity holds less useful water each year as silt accumulates, so a percentage computed against the original design figure can understate the loss. Meanwhile a flood control reservation above the conservation pool is empty on purpose for much of the year, and filling it completely during a storm may require releasing water afterwards to make room.
Two numbers get published, and they answer different questions. Percent of total capacity answers how full the basin is. Percent of the historical average for the same date answers whether that is normal for this point in the year. In Spain, national supply-side storage sat at roughly 52.3 percent in the July 2026 ministry drought report, a figure its own monitoring treated as separate from the scarcity scenarios declared per basin.
| Percent of total capacity | What it usually signals | Typical management response |
|---|---|---|
| Above 90 percent | Comfortable margin in most climates | Routine monitoring, releases for downstream and ecological needs |
| 70 to 90 percent | Normal operating range, watch the season | Public bulletins move from routine to regular updates |
| 50 to 70 percent | Reduced buffer for a dry spell or a hot summer | Water allocation reviews, voluntary savings, staged planning |
| 30 to 50 percent | Stress on multi-year reliability | Pre-alert or alert scenarios, restrictions on lower-priority uses |
| Below 30 percent | Emergency planning territory in most systems | Emergency scenarios, priority cutbacks, public appeals |
These bands are orientation, not law. A high-rainfall reservoir at fifty percent can be in better shape than a Mediterranean one at seventy, and a reservoir used mainly for flood control has a different curve from one that has to carry a city through August.
Why one reservoir level does not determine household water
Stored water sits upstream of everything that decides whether a tap runs. Between the reservoir and the kitchen sink sit treatment works with a fixed capacity, storage tanks, pumps, a distribution network, and rules about who gets served first.
Many cities draw on several sources at once. Surface reservoirs may cover part of demand while groundwater wells, river intakes, recycled water or desalination cover the rest. A falling reservoir level therefore reduces one input among several, and how much it matters depends on how big a share that input represents.
Low storage also changes the water itself. With less volume there is less dilution, so salts, algae and nutrients can concentrate above what a treatment plant was designed to handle. Some systems respond by blending in groundwater, changing disinfectant practice or asking for tighter conservation, which is why a water restriction can appear while the lake still looks full.
How seasonal trends change the meaning of a percentage
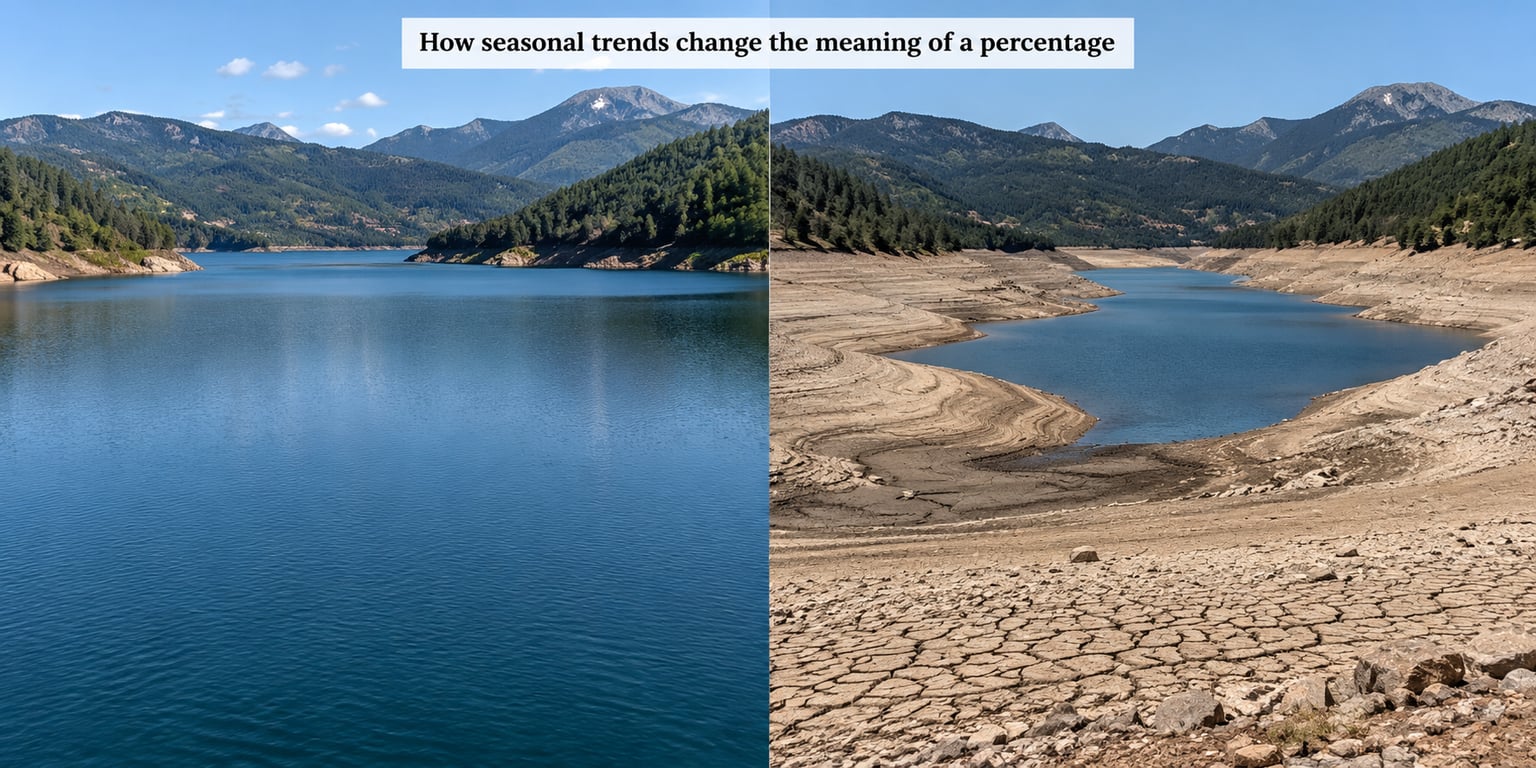
The same percentage means different things in different months, because reservoirs fill and drain on a schedule. In wetter regions the pattern runs from a winter high through a summer low; in Mediterranean climates the peak often arrives later, with autumn and winter storms refilling what summer irrigation took.
Winter figures matter most because they set the starting point for the year. A reservoir that ends the rainy season close to full enters summer with a real buffer. The same reservoir at the end of a dry winter enters every hot month already behind.
Summer is when the number stops being an academic question. Rainfall contributions fall away, irrigation demand rises, evaporation climbs with temperature and wind, and any reservoir with a warm shallow surface can lose meaningful volume to evaporation alone in hot months. A steady decline through July and August is expected; the pace of that decline is the signal.
Autumn readings are the ones that settle the bill. Refill rates that recover storage to the previous autumn’s level suggest a system that absorbed a dry year. Weak refill rates, especially repeated over several years, point to a structural problem rather than weather.
Why falling levels matter even before restrictions begin
A falling number shrinks the safety margin quietly. Restrictions arrive after pressure builds, so the period when a falling trend is most informative is usually before any announcement, not after.
Warning signs include repeated weekly declines that no rainfall reverses, inflows that lag what the watershed normally delivers, and reservoirs that refill more slowly each autumn than the one before. A single dip after a dry fortnight means little. Three dips in a row mean the system is not recovering between them.
There is one more effect worth knowing about. Operators who enter a dry season with full basins will sometimes hold water back rather than release it early, because storage left in the reservoir at the start of summer is worth more than the same water released in spring. That means levels can look deliberately conservative while supply is actually comfortable.
Levels are also a lagging indicator. They record water already stored, not water still to come. Snowpack, soil moisture and inflow forecasts tell you about next month; the gauge tells you about yesterday. Forecast-informed reservoir operations exist precisely because acting on the current level alone means releasing water that the forecast shows you will need later.
How drought, climate change and competing demand affect reservoirs
Storage numbers move for reasons that have little to do with any single season. Multi-year drought removes the recovery that normally resets a system, so a third dry year starts from a deficit rather than from a full basin.
Heat works on both sides of the ledger. Warmer air increases evaporation from the water surface and from soil and vegetation in the catchment, and longer summers mean a longer drawdown season. Higher demand for cooling, irrigation and drinking water arrives at the same time.
Growth and allocation matter too. New housing, industrial demand and expanded irrigation all draw on the same stored volume, and when demand outgrows supply, operators convert the gap into restrictions, which lowers actual consumption but shifts the pressure onto a smaller base.
Sedimentation is the quiet one. Every reservoir behind a dam loses capacity as its catchment delivers sediment, and unlike a drought it never reverses. It also concentrates inflow problems, because a smaller basin responds faster and harder to any single storm.
Finally, note that official drought or scarcity status is a separate determination made by an agency against published thresholds for a given area. Storage percentage feeds into it, but it does not by itself produce a declared emergency, and a declared shortage does not require a percentage below any particular number. In Spain that separation is explicit: drought conditions and water scarcity scenarios are assessed independently, by basin, with thresholds that differ between basins.
Where to find reliable reservoir-level information
Start with the operator, then widen out. Dam and utility operators publish gauge readings and storage volumes because they are the ones responsible for the number. Basin agencies and river authorities add the catchment context, and national drought observatories or government water ministries publish the official status maps and scenario declarations.
Whatever dashboard you use, check six fields before you read anything into a figure. First the date and update time, because bulletins lag and some go stale for weeks. Second the reservoir or system, since a national average hides more than it explains. Third the denominator, whether the percentage is against total capacity or against the average for the date.
Then check the trend, at four to twelve weeks, and the forecast, which is usually a separate inflow or seasonal outlook page. Finally, look for the local restrictions or conservation stage notice, because that is the part with legal force behind it.
If a source you rely on stops updating, treat its last figure as expired. A page that carries an old number without warning is worse than no page, and that is one of the habits that erodes trust in water reporting fastest.
How to judge whether water supply is at immediate risk
Immediate risk is rare. Utilities plan years ahead, and the failure mode is almost never a dry tap; it is a stretch of higher restrictions, a bigger price rise, or tighter limits on irrigation. Judge risk by combining signals rather than reading one.
| What to check | Comfortable | Worth acting on |
|---|---|---|
| Storage against capacity | Within a few points of the seasonal average | Well below it and falling |
| Storage against the average for the date | Above the ten-year norm | Below the ten-year norm for several weeks |
| Autumn refill rate | Returns to the previous year’s level | Weaker each year in sequence |
| Inflow and soil moisture outlook | Near or above normal | Below normal for the season ahead |
| Official status | Normal scenario | Pre-alert, alert or emergency scenario |
| Local conservation stage | Voluntary guidance | Mandatory stage with limits |
If three or more of those sit in the right-hand column, treat the situation as real rather than as a headline, and check your basin’s own thresholds since they differ almost everywhere. Your household supply may be fed by groundwater that has nothing to do with the reservoir figures, and for anyone with a private well, the aquifer question matters more than the lake.
Frequently Asked Questions
Is a low reservoir percentage an immediate sign that taps will run dry?
Almost never. Utilities and river authorities manage storage years ahead, and household supply usually draws on a mix of reservoirs, groundwater, river intakes and recycled water. A low percentage shows reduced resilience and makes restrictions more likely, not a dry tap. The real signal is a combination: a level well below the average for the date, a persistent downward trend, a weak inflow outlook and an official conservation stage already in force.
What percentage of reservoir capacity is considered low for water supply?
In most systems, below 50 percent of total capacity is treated as a meaningful reduction in buffer, and below 30 percent triggers emergency planning. Those thresholds are a rough orientation, not a rule. A Mediterranean reservoir at seventy percent in August may be more exposed than a northern one at fifty, because the seasonal average it should be compared against is different.
Why can one region have drought restrictions while reservoirs elsewhere remain full?
Two reasons. Restrictions are usually tied to the local system’s own thresholds and its mix of sources, not to a national storage figure, and each basin sets thresholds differently. Second, storage and official status are judged separately. Spain’s drought monitoring, for example, assesses prolonged drought and water scarcity scenarios independently and by basin, so a country can report a comfortable supply percentage while a specific territory sits in alert or emergency.
Can reservoir levels recover quickly after rainfall?
Sometimes, and the speed depends on catchment size and where the rain falls. Small urban reservoirs can refill within days of a storm; large ones with big catchments usually need sustained rainfall over weeks, and much of the first rain is lost to soil and vegetation before it reaches the water. A single downpour rarely reverses a multi-week decline, which is why operators read soil moisture and inflow forecasts rather than weather headlines.
How do reservoir levels affect household water pressure and restrictions?
Pressure usually changes last. When storage falls, managers first tighten rules on low-priority uses such as garden irrigation, car washing and filling pools, then reduce non-essential industrial and agricultural allocations, then move to percentage cutbacks across all users. Pressure and quality issues tend to surface when treatment or network capacity is strained, which can happen at normal storage levels during a heatwave.
Should residents rely on reservoir data or local groundwater and river levels?
Use both, for different purposes. Reservoir data tells you about the reliability of surface storage and whether restrictions are likely. Groundwater and river levels tell you about the local buffer underneath, which often determines what a household or a private well actually experiences. If you rely on a well, the aquifer and your well depth matter far more than the level of a reservoir two valleys away.
Conclusion
No single percentage tells you whether water supply is safe. Read it against the average for that date, check whether it is rising or falling, weigh the inflow outlook, and then look at what the official status actually says for your area.
If those four agree, there is no reason to act beyond sensible saving. If they disagree, trust the combination over any single number.